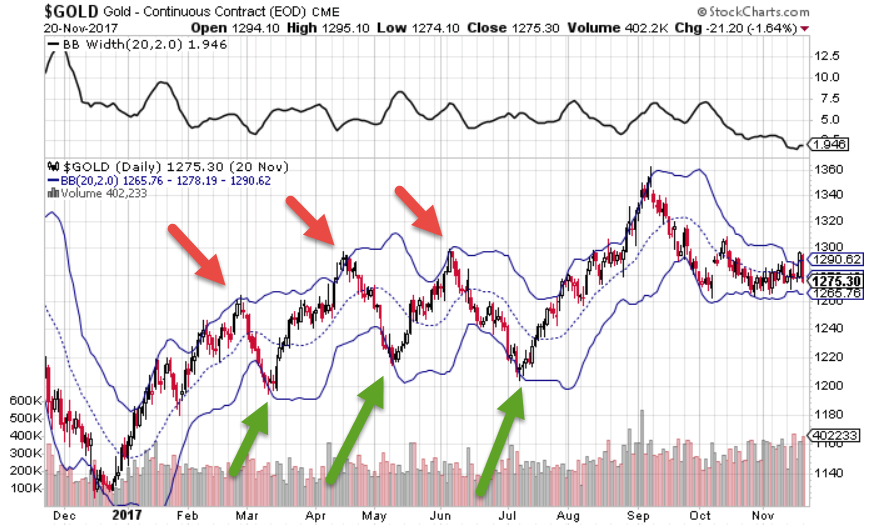
There are several trading strategies that can be used to generate returns using contract for differences. CFD’s are leverage products that allow you to trade stocks, indices, and commodities, and only be responsible for the difference between the purchase and sale price. One of the best ways to get a gauge of volatility and determine how far the preverbal rubber band can stretch, is to use Bollinger bands as a technical indicator.
The Bollinger band indicator, was created by John Bollinger as a way to gauge the historical distribution of a price of a security over an allotted time. The Bollinger bands are calculated using a default method by adding and subtracting 2-standard deviations of a specific period to that periods moving average. Generally the default for the moving average used in a Bollinger band is the 20-day moving average, but this can be altered based on your preference.

The Bollinger bands track the distribution of prices around a specific moving average. In the chart of Gold the Bollinger bands that uses 2-standard deviations around the 20-day moving average encapsulates 95% of all the trading points during a 20-day period.
Basic Bollinger Band Strategy
The basic Bollinger band strategy says that when prices reach the Bollinger band low, they have fallen to far too fast and represent a buying opportunity. When prices rise to the Bollinger band high, they have rallied too quickly and represent a selling opportunity. The green arrows display buying opportunities while the red arrows show selling opportunities.
You can change the defaults of the Bollinger bands to generate a strategy that will fit your risk profile. If you are looking for more opportunities as markets chop around, you can lower the number of days in the distribution as well as, decrease the standard deviation. A 10-day moving average and 1-standard deviation would capture 66% of all data points, which means that a signal would be generated when a prices was within 34% of the prices, as opposed to 2-standard deviations which is 95%.
If you were looking for fewer signals and only wanted to know when a real anomaly occurred, you could increase the number of days to 50 or 100, and increase the standard deviations to 3. By using a 100-day moving average and 3-standard deviations you would capture 1% of the outliers over a 100-day period.
Volatility
Since Bollinger bands use a standard deviation they capture the volatility of the securities you are analyzing. When Bollinger bands contract, volatility is declining and when Bollinger band expand, volatility is rising. This can be measured with the Bollinger band width. This is calculated by subtracting the Bollinger band high from the Bollinger band low. When the Bollinger band width is elevated volatility is high and when the Bollinger band width is low, volatility is low. Low levels of volatility usually point to consolidation, and mean reversion which high levels of volatility can point to breakouts and breakdowns.
Bollinger bands are one of the best tools you can use to generate a strategy that is based on mean reversion. By combining the Bollinger bands with the Bollinger band width, you can also measure volatility.


